Archived
Building An Interactive Infographic With Vue.js

Building An Interactive Infographic With Vue.js
Building An Interactive Infographic With Vue.js
Krutie Patel
2018-11-19T13:00:30+01:00
2018-11-19T12:43:40+00:00
This article presents a modern approach to building an interactive infographic. You sure can have plain infographic with all the information available upfront — without any user interaction. But, thinking of building an interactive experience — changes the technology landscape we choose. Therefore, let’s understand first, why Vue.js? And you’ll see why GSAP (GreenSock Animation Platform) and SVG (Scalable Vector Graphics) become obvious choices.
Vue.js provides practical ways to build component-based, dynamic user interfaces where you can manipulate and manage DOM elements in powerful ways. In this instance, it’s going to be SVG. You can easily update and manage different SVG elements — dynamically — using only a small subset of features available in Vue.js — some of the staple features that fit the bill here, are, data binding, list rendering, dynamic class binding to name a few. This also allows you to group relevant SVG elements together, and componentize them.
Vue.js plays nice with external libraries without losing its glory, that is GSAP here. There are many other benefits of using Vue.js, one of which is that, Vue.js allows you to isolate related templates, scripts, and styles for each component. This way, Vue.js promotes modular application structure.
Recommended reading: Replacing jQuery With Vue.js: No Build Step Necessary
Vue.js also comes packaged with powerful lifecycle hooks that let you tap into the different stages of application to modify application behavior. Setting up and maintaining Vue.js applications doesn’t require a big commitment, meaning you can take phased-approach to scale your project as you go.
The infographic is very light-weight in a visual sense, as the main aim of this article is to learn how to think in terms of data, visual elements, and of course, Vue.js — the framework that makes all the interactivity possible. In addition, we’ll use GreenSock, a library for animating SVG elements. Before we dive in, take a look at the demo.
Front-end is messy and complicated these days. That’s why we publish articles, printed books and webinars with useful techniques to improve your work. Even better: Smashing Membership with a growing selection of front-end & UX goodies. So you get your work done, better and faster.
Explore Smashing Membership ↬
We’ll start with:
The infographic that we’re going to build is about Tour De France, the annual bicycle racing event held in France.
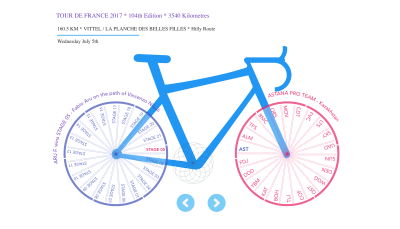
Tour De France — Interactive bicycle listing game stages (rear-wheel) and participating teams (front-wheel). (Large preview)
Overview Of Tour De France Data
In infographic design, data drives the design of your infographic. Therefore, while planning your infographic design, it’s always a good idea to have all data, information, and statistics available for the given subject matter.
During Tour De France of 2017, I learned everything about this biggest cycling event that I could in 21 days of the game in July, and I familiarized myself with the subject.
Basic entities of the race that I decided to go for in my design are,
- Stages,
- Teams,
- Routes,
- Winners,
- Length and classifications of each routes.
This next part of the process depends on your thinking style, so you can be creative here.
I created two sets of data, one for stages and other for teams. These two datasets have multiple rows of data (but within limit) — which matched with two wheels of the bicycle with multiple spokes in each. And that defined the key element of the design, The Bicycle Art that you saw at the beginning — where each spoke will be interactive & responsible to drive what information is revealed on screen.
I mentioned within limits above, because what we’re aiming for in this instance is not a full-blown data-visualization in context of big data but rather an infographic with high-level data.
Therefore, spend quality time with data and look for similarities, differences, hierarchy or trends that can help you convey a visual story. And don’t forget about the amazing combination of SVG and Vue.js while you’re at it, as it will help you bring about the right balance between information (data), interactivity (Vue.js) and design elements (SVG Artwork) of infographic.
Here’s the snippet of a stage data object:
{ "ID": 1, "NAME": "STAGE 01", "DISTANCE": "14", "ROUTE": "KMDÜSSELDORF / DÜSSELDORF", "WINNER": "THOMAS G.","UCI_CODE": "SKY","TYPE": "Individual Time Trial","DATE": "Saturday July 1st","KEY_MOMENT": " Geraint Thomas takes his first win at 32"}
And team data object snippet as below:
{ "ID": 1,"UCI_CODE": "SKY","NAME": " TEAM SKY","COUNTRY": "Great Britain","STAGE_VICTORIES": 1,"RIDERS": 8}
This infographic is operated by a very simple logic.
UCI_CODE (Union Cycliste Internationale) is the connecting key between the stage and the team object. When a stage is clicked, first we’ll activate that stage, but also use UCI_CODE key to activate corresponding winning team.
SVG Preparation
Having a couple of datasets and a rough concept of bicycle art ready, here’s the static SVG CodePen of the infographic I came up with.
See the Pen Static Bicycle SVG by Krutie(@krutie) on CodePen.
We have created only one spoke for each wheel, that is because we’ll dynamically create rest of the spokes using a number of records found in the dataset, and animate them using GreenSock Library.
The workflow to create this SVG code is also very simple. Create your Infographic artwork in Adobe Illustrator and save as SVG. Make sure to name each group and layer while working in Illustrator, because you will need those ids to separate parts of SVG code that will eventually populate area of Vue components. Remember that layer names given in Illustrator become element ids in SVG markup.
You can also use SVGOMG and further optimize SVG code exported from Adobe Illustrator.
Important Note: If you use SVGOMG to optimize SVG markup, your code certainly will look neat, but note that it will convert all elements into with d attribute. This results into losing x and y values of the rectangle, in case you wish to adjust few pixels manually later-on.
Second thing, make sure to uncheck Clean Id option (right-hand side options in SVGOMG interface), this will help maintain all groups and ids intact that were created in Illustrator.
Vue Component Overview
Even if interactivity and data-flow in your infographic project is quite simple in nature, you should always take a moment to draw up a tree diagram of components.
This will especially help in case you’re not using any shared-data mechanism, where child components are dependent on the values sent from the parent component (i.e. via props) or vice-versa (i.e. this.$emit events). This is your chance to brainstorm these prop values, emit events and local data — and document them before starting to write the code.
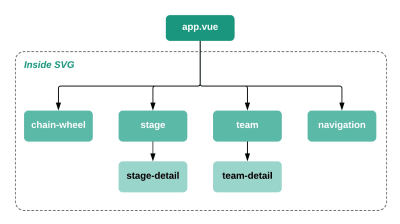
Vue component tree. (Large preview)
Diagram above is the snapshot of Vue components that is partially derived from interactivity requirements and partially based on SVG markup. You should be able to see how SVG markup will be split up based on this tree structure. It’s pretty self-explanatory from hierarchy view-point.
The diagram below represents the same Vue components seen above, but in the context of the infographic design.
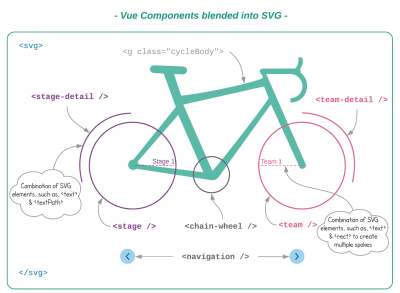
Vue Components blended into SVG. (Large preview)
Less is more — should be the approach you should try to take while working on similar projects. Think through the animation and transition requirements you have, if you can get away with using TweenLite instead of TweenMax — do so. If you have the option to choose elementary shapes and simpler paths over complex ones — by all means try to opt-in for light-weight elements that are easy to animate — without any performance penalty.
Next section will take you through an exciting part with GreenSock animation and Vue.js.
GreenSock Animation
Let’s take a closer look at:
Animating Text On A Curved Path
Remember the curve path seen around the bicycle wheel, that curved path is slightly bigger than the radius of the bicycle wheel. Therefore, when we animate text on this path, it will look as if it follows the shape of the wheel.
See the Pen Text on a Curved Path by Krutie (@krutie) on CodePen.
path and textPath is a sweet combination of SVG elements that allows you to set text on any path using xlink:href attribute.
<path id="curvedPath" stroke="none" fill="none" d="..."/><text><textPath xlink:href="#curvedPath"class="stageDetail"startOffset="0%">{{ stage.KEY_MOMENT }}</textPath></text>
To animate text along the path, we’ll simply animate its startOffset attribute using GreenSock.
tl.fromTo( ".stageDetail", 1, { opacity: 0,attr: { startOffset: "0%" }},{opacity: 1,attr: { startOffset: "10%" }}, 0.5 );
As you increase the startOffset percentage, text will travel further through the circle perimeter.
In our final project, this animation is triggered every time any spoke is clicked. Now, let’s move on to a more exciting part of the animation.
Animating Stages/Spokes Inside The Wheel
It’s visible from the demo that stage and team components are similar in nature with couple of small differences. So, let’s focus on just one wheel of the bicycle.
The CodePen example below zooms in on just the three key ideas:
See the Pen TDF Wheel Animation by Krutie (@krutie) on CodePen.
You may have noticed in the static SVG CodePen above that the spokes are nothing but SVG rectangles and text grouped together. I have grouped them together since I wanted to pick both text and rectangle for the purpose of animation.
<g v-for="stage in stages"class="stage"><rect x="249" y="250" width="215" height="1" stroke="#3F51B5" stroke-width="1"/><text transform="translate(410 245)" fill="#3F51B5" >{{ stage.NAME }}</text></g>
We will render them in area of the Vue component using values fetched from the data-source.
When all 21 stages are available on screen, we’ll set their initial positions by calling, let’s say, setSpokes().
// setSpokes()

let stageSpokes = document.querySelectorAll(".stage")
let stageAngle = 360/this.stages.length

_.map(stageSpokes, (item, index) => {
    TweenMax.to(item, 2,
    { rotation: stageAngle*index,
      transformOrigin: "0% 100%"
    }, 1)
}
Three key elements of setting the stage are:
To rotate spokes, we’ll simply map through all elements with className
stage, and set dynamic rotation value that is calculated for each spoke.
Notice
transformOrigin value in the code above, which is as important as index value, because “0% 100%” enables each spoke to rotate from the center of the wheel.
This is calculated using total number of stages divided by 360-degree. This will help us lay every spokes evenly in 360-degree circle.
ADDING INTERACTIVITY
Next step would be to add click-event on each stage to make it interactive and reactive to data changes — hence, it will breathe more life into an SVG image!
Let’s say, if stage/spoke is clicked, it executes goAnimate(), which is responsible to activate and rotate the stage being clicked using the stageId parameter.
goAnimate (stageId) {

  // activate stage id
  this.activeId = stageId

  // rotate spokes

}
We’ll use DirectionalRotationPlugin…which is a key ingredient for this interactivity. And yes, it is included in TweenMax.
There are three different ways of using this plugin. It animates rotation property in 1) clockwise, 2) counter-clockwise and 3) in the shortest distance calculated to the destination.
As you’d have guessed by now, we’re using the third option to rotate the shortest distance between the current stage and new stage.
Review the CodePen above and you’ll see how Stage 01 is constantly moving around the circle, leaving its original spot for new active stage at 0-degree angle.
First, we need to find the angle of a stage being clicked, and interchange its rotation with Stage 01. So, how do we find the rotation value of the stage being clicked? Check out the diagram below.

Distance calculation from Stage 01 to the ‘clicked’ stage. (Large preview)
For example, if Stage 05 is clicked (as you can see above), the journey from Stage 01 to Stage 05 — requires 4 x angle-value.
And therefore, we can get the correct angle using, (Active stage Id - 1) * 17 degree, followed by ‘_short’ string postfix to trigger directional rotation plugin.
angle = 360/21 stages = 17 activeId = 5new angle = ((activeId-1)*angle)+'_short'= ((5-1)*17)+'_short'= 68
The final goAnimate() function will look something like below:
_.map(spokes, (item, index) => { if(activeId == index+1) { // active stage TweenMax.to(item, 2, { rotation: 0+'_short', transformOrigin: "0 100%" }) } else if (index == 0) { // first stage TweenMax.to(item, 2,{ rotation: (activeId*angle)-angle+'_short',transformOrigin: "0 100%"})} else {TweenMax.to(item, 2,{ rotation: index*angle+'_short',transformOrigin: "0 100%"})}}) // end of map
Once we have the rear wheel ready, the front wheel (for team) should follow the same logic with a couple of tweaks.
Instead of stage, we’ll fetch team data and update registration point of transformOrigin attribute to enable spokes generation from opposite registration point than the stage wheel.
// set team spokes

map(teamSpokes, (index, key) => {
  TweenMax.to(index, 2,
  { rotation: angle*key,
    transformOrigin: "100% 100%"
  }, 1)
})
Final Project
Like me, if you have written all animation and data related functions in Vue components itself. It’s time to clean them up using Vuex and Mixins.
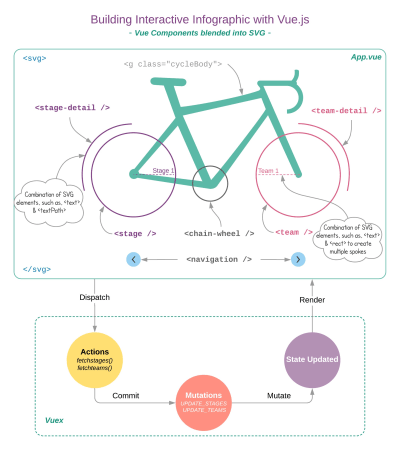
Using Vuex state management to power both wheels with data. (Large preview)
VUEX
Vuex eases up the management of shared data among components, and more importantly, it streamlines your code, keeping methods and data() clean and tidy, leaving components only to render the data, not to handle it.
Lifecycle hooks are a very suitable place to perform any HTTP requests. We fetch initial data in created hook, when the Vue application has initialized, but hasn’t yet mounted into the DOM.
Empty state variables, stages and teams are updated using mutations at this stage. We then, use watcher (only once) to keep track of these two variables, and soon as they’re updated, we call in animation script (from mixin.js).
Every time user interacts with stage or team component, it will communicate with Vuex store, executes setActiveData, and updates current stage and current team values. That is how we set active data.
And when the active data is set after state update, goAnimate will kick in to animate (directional rotate) spokes using updated values.
Recommended reading: Creating Custom Inputs With Vue.js
Mixins
Now that the data is handled by Vuex, we’ll separate out GreenSock animations. This will prevent our Vue components being cluttered with long animation scripts. All GreenSock functions are grouped together in mixin.js file.
Since you have access to Vuex Store within Mixins, all GSAP functions use state variables to animate SVG elements. You can see fully functional store.js and mixin.js in the CodeSandbox example over here.
Conclusion
Creating interactive and engaging infographics requires you to be analytical with the data, creative with visuals and efficient with the technology you use, which in this case is Vue.js. You can further use these concepts in your project. As a closing note, I’ll leave you with this circular interactive color wheel below that uses an idea similar to the one we’ve discussed in this article.
See the Pen Material UI Circular Colour Palette made with Vue JS and GSAP by Krutie (@krutie) on CodePen.
With no doubt, Vue.js has many great features; we’re able to create interactive infographics with just a few things, such as watchers, computed properties, mixins, directive (see color-wheel example) and a few other methods. Vue.js is the glue that holds both SVG and GreenSock animation together efficiently, giving you ample of opportunity to be creative with any number of subject matter and custom interactivity at the same time.
![]()
(rb, ra, yk, il)
From our sponsors: Building An Interactive Infographic With Vue.js


